Space Industry Structure Part 3: Space Stock Investing

Most space companies are not yet very profitable. Even so, the market values them highly. That’s because investors are focused on what these companies could earn in the future—in other words, their future value.
But future value can’t be judged on hope alone. In this article, we use numbers to see how fast the space industry is really growing, look at the signals that reveal the future value of space companies that aren’t yet profitable, and walk through how to evaluate individual companies and space ETFs.
How Big Is the Space Industry Today?
1The Size of the Global Space Economy
The Space Foundation, a U.S. nonprofit research organization, measures the size of the global space economy every year. Its figure combines space-related revenue from companies with the space budgets of governments around the world.
| Year | Global space economy | Year-over-year |
|---|---|---|
| 2023 | $570 billion | — |
| 2024 | $613 billion | +7.8% |
| 2025 | $686 billion | +12% |
The 12% growth in 2025 was the fourth-highest rate since the organization began tracking in 2006. Average annual growth over the past five years has also been close to 10%, showing that the space industry is growing steadily and quickly year after year.
2Who Spends the Money, and Who Earns It?
Look closely at the space economy, and something surprising stands out. Despite its image as a government industry, most of the money already comes from commercial activity by companies.
| Category | 2025 size | Share |
|---|---|---|
| Commercial activity (company revenue) | About $544.3 billion | About 79% |
| Government budgets (53 countries combined) | About $141 billion | About 21% |
Commercial activity is roughly four times larger than the combined space budgets of 53 governments. Of that government spending, the United States accounts for about 57%, by far the largest share. The shift from Old Space to New Space covered in Part 1 shows up clearly in the numbers.

3How Big Will It Get? — Forecasts by Organization
Several organizations expect the space economy to surpass $1 trillion. Their numbers, however, vary quite a bit.
| Organization | Forecast |
|---|---|
| Space Foundation | Could top $1 trillion as early as 2032 |
| Novaspace | $626.4 billion in 2025 → over $1 trillion by 2034 |
| McKinsey & World Economic Forum | $1.8 trillion by 2035 |
How Has the Money Flowed?
1The Flow of Private Investment
To see whether an industry is growing, follow where the money goes. Private investment in space companies has swung sharply over the past decade.
※ Investment figures vary by source because each organization uses a different methodology.
2Lessons from the Boom and Correction
The 2021 peak wasn’t built on fundamentals alone. That year, 11 space companies, including AST SpaceMobile, Planet, and Rocket Lab, went public by merging with SPACs (special purpose acquisition companies). Because a SPAC merger is simpler than a traditional IPO, even companies with almost no revenue could go public on the strength of high expectations.
The results were harsh. After going public, space SPAC stocks fell an average of 35%, and investment cooled sharply in 2022 and 2023. Since then, the market has shifted from betting on dreams to looking at actual revenue and contracts, and the companies that survived are now being judged on their results.

Indicators of Industry Growth
Market size forecasts are estimates, but some numbers show what is actually happening. Here are four indicators that reveal whether the space industry is really growing.
1Launches — Is Access to Space Expanding?
| Year | Global orbital launch attempts |
|---|---|
| 2020 | About 114 |
| 2022 | 186 |
| 2023 | 223 |
| 2024 | About 259 |
| 2025 | About 320 (315 successful, an all-time high) |
Launches nearly tripled in five years. SpaceX alone flew 165 missions, more than half of all successful launches worldwide. This is the reusable rocket technology from Part 2 showing up in real numbers.
2Satellites — Are More Going into Orbit?
In 2025, a record 4,517 satellites reached orbit, up 58% from the previous year. Of those, 87% were commercial satellites owned by companies. That’s a clear sign that companies, not governments, are now the ones putting satellites into space.
3Government Budgets — Is the Biggest Customer Spending More?
Governments remain one of the largest customers of space companies. But even within government, the money is shifting direction.
| Agency | Budget trend |
|---|---|
| U.S. Space Force (defense) | About $15 billion in FY2021 → about $40 billion in FY2026 |
| NASA (civil space) | About $24.4 billion in FY2026, roughly flat from the year before |
The Space Force’s budget jumped in 2026 largely because about $13.8 billion tied to the Golden Dome missile defense program was added in a single year. That extra funding is mostly one-time, so it remains to be seen whether spending will stay at that level. Still, the broader trend is clear: government demand in space is growing fastest in defense and security, not science.
4Company Revenue — Are Companies Actually Making Money?
Finally, let’s check whether industry growth is turning into revenue at individual companies.
| Company | Annual revenue trend | Latest quarter (2026) |
|---|---|---|
| SpaceX | Starlink revenue: $7.7 billion in 2024 → $11.4 billion in 2025 | Q3 total revenue of $14.6 billion (+161% YoY), with net income of $4.0 billion |
| Rocket Lab | $62 million in 2021 → $602 million in 2025 (about 10x) | Q2 revenue of $234 million (+62% YoY, a record) |
| Planet Labs | $244.4 million in FY2025 → $307.7 million in FY2026 | FY2027 Q2 revenue of $116.1 million (+58% YoY, a record) |
※ Planet Labs’ fiscal year runs from February to January. For example, fiscal 2026 covers February 2025 through January 2026.
All three companies are growing quickly, both annually and in their latest quarters. In 2026, all three posted quarterly revenue growth of more than 50% year over year. Industry growth isn’t just a forecast; it is turning into real revenue at real companies.
SpaceX’s revenue mix is also changing fast. In 2025, Starlink made up about 61% of total revenue, but in the third quarter of 2026, AI revenue topped $7.5 billion, more than half of the total. When you look at space companies, keep in mind that their main sources of revenue can shift over time. We’ll look at company numbers in more detail in Section 7.
How to Read the Future Value of Space Companies
Revenue is growing fast, but many space companies are still losing money. That makes it hard to judge them on current earnings alone.
In space, companies have to pour huge sums into rockets and satellite networks before they start making money. That’s why fast-growing companies often post losses. Even SpaceX, with $18.7 billion in revenue in 2025, posted a net loss of about $4.9 billion as it spent heavily on its next-generation Starship rocket and other projects. Rocket Lab’s revenue grew 38% in 2025, but it still lost about $200 million.
Companies can turn profitable as they scale, though. SpaceX lost $541 million in the second quarter of 2026, then earned $4.04 billion in the third quarter, swinging to a profit. But many more, including Rocket Lab and Planet Labs, are still losing money.
Without profits, traditional metrics like the price-to-earnings (P/E) ratio don’t work well. Instead, you need to look at other signals that show how much a company can earn in the future.
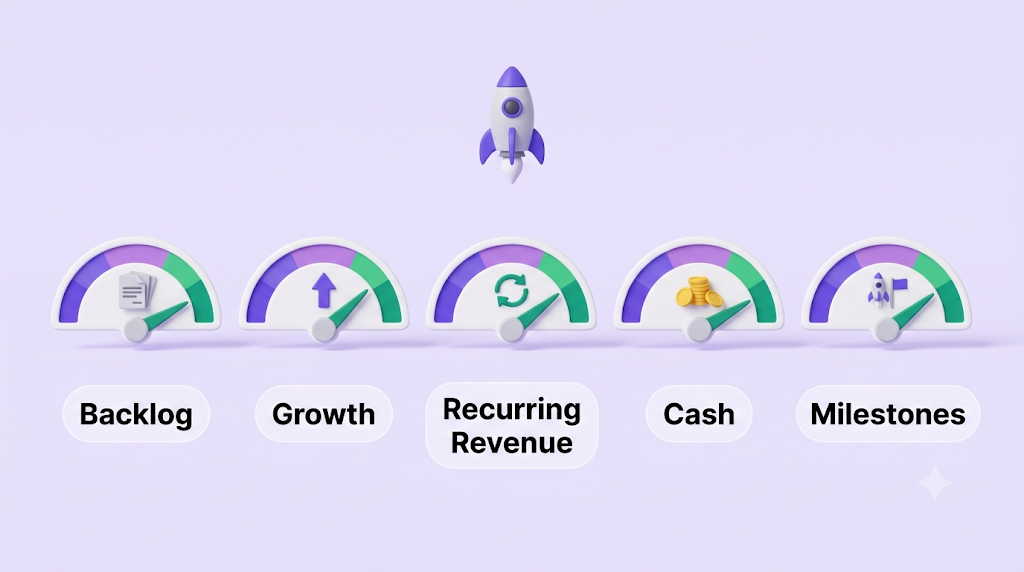
In this section, we’ll go through the five signals to watch when gauging the future value and growth potential of space companies.
1Backlog — Future Revenue Already Secured
Backlog is money from signed contracts that hasn’t been recognized as revenue yet. If backlog keeps growing, it’s a sign that the foundation for future revenue is getting stronger, even without profits today.
| Company | Backlog | What it means |
|---|---|---|
| SpaceX | $47.5 billion at the end of Q2 2026 | More than twice its 2025 revenue |
| Rocket Lab | $1.85 billion at the end of 2025 → about $2.36 billion at the end of Q2 2026 | Up 137% year over year, a record |
| Planet Labs | About $900 million at the end of FY2026 → about $815 million at the end of FY2027 Q2 | Lower, but converting quickly into revenue |
When looking at backlog, also check when it will turn into revenue. Planet Labs expects about half of its backlog to be recognized within the next 12 months and about 70% within 24 months.
It’s also worth knowing that a shrinking backlog isn’t always a bad sign. Planet Labs’ backlog fell from about $900 million to $815 million in six months, yet quarterly revenue hit a record over the same period. The backlog shrank because existing contracts were turning into actual revenue. So don’t judge backlog by a single number; look at how fast new contracts are coming in and how fast they’re converting into revenue.
2Revenue Growth — How Fast Is It Growing?
The pace of growth matters more than the absolute size of revenue. Rocket Lab’s quarterly revenue topped $200 million for the first time in the first quarter of 2026, then set another record at $234 million in the second quarter. It expects third-quarter revenue of $250 million to $265 million. Planet Labs raised its outlook and now expects fiscal 2027 revenue to grow 40% to 43%. The key questions are whether growth is speeding up or slowing down, and whether the company actually delivers on its guidance.
3Recurring Revenue and Government Contracts — How Stable Is Revenue?
As covered in Part 1, recurring revenue from subscribers who pay every month is more stable than one-off contracts. Government and defense contracts are also large and long-term, providing a solid base. At Planet Labs, 59% of fiscal 2026 revenue came from defense and intelligence agencies, and 98% of its annual contract value is recurring. The larger the share of recurring revenue and long-term government contracts, the more predictable a company’s future becomes.
But recurring revenue has to be judged on both quantity and quality. Starlink subscribers doubled in a year to 12 million at the end of the second quarter of 2026, yet the company’s reported average revenue per user (ARPU) fell about 22%, from $85 to $66. Then, in the third quarter, subscribers rose to 13.6 million and ARPU rebounded to $69. That’s why subscriber counts and revenue per user should always be read together.
4Cash and Funding — Can It Hold Out Until It Succeeds?
For a company that’s losing money, the most practical question is whether its cash will last until the technology pays off. Check whether it has enough cash on hand, whether operations are bringing cash in or burning it, and whether it will need to issue new shares. Issuing a lot of new stock can dilute the value of existing shareholders’ stakes.
Planet Labs is a good example. It still reports a net loss on paper, but in fiscal 2026 it posted positive annual free cash flow (cash from operations minus capital spending) for the first time. In the second quarter of fiscal 2027, its net loss also narrowed sharply to $9.4 million, from $22.6 million a year earlier. Even a company that’s losing money is building staying power if its cash flow is improving.
5Technical Milestones — Is the Company Hitting Its Targets?
Much of a space company’s value rests on the expectation that a technology will succeed. That’s why hitting technical milestones on schedule—first launches, reaching orbit, satellite deployments—is a key driver of its value. When schedules slip again and again, expectations fall too. Rocket Lab’s medium reusable rocket, Neutron, saw its first launch pushed back several times before being delayed to 2027.
A Milestone Calendar — What to Watch Next
The technologies covered in Part 2 face major tests over the next few years. These milestones can directly affect the value of the companies involved.
| Technology | Milestone to watch | Companies |
|---|---|---|
| Fully reusable rockets | First Starship second-stage catch, more frequent launches | SpaceX |
| Medium reusable rockets | Neutron’s first launch (expected in 2027) | Rocket Lab |
| Satellite communications deal | Closing of the Iridium acquisition (expected mid-2027) | Rocket Lab |
| Direct-to-device | Pace of satellite deployment, expansion of voice and data service | AST SpaceMobile, SpaceX |
| Hyperspectral imaging | Launch of additional Tanager satellites | Planet Labs |
| In-orbit servicing | First satellite servicing mission by the robotic servicer | Northrop Grumman |
| Space data centers | Test satellite launches and real computing results | SpaceX, Google, Starcloud |
The Five Signals at a Glance
Here’s a quick summary of the five signals.
| Signal | What to look at | Positive sign |
|---|---|---|
| Backlog | Value of contracts yet to be recognized | Steady growth |
| Revenue growth | Year-over-year revenue increase | Fast growth with narrowing losses |
| Recurring revenue & government contracts | Stability of revenue | A growing share |
| Cash & funding | How long the company can hold out | Improving cash flow, no excessive share issuance |
| Technical milestones | Whether launches and deployments happen as planned | Delivered on schedule |
Common Traps When Judging Future Value
② When stocks move on hype alone — Like the 2021 listing frenzy in Section 2, shares that rise just because a company has “space” in its name can fall just as fast.
③ When a single metric moves the stock — SpaceX shares fell more than 6% after strong second-quarter results in 2026 because ARPU declined. The higher the expectations, the more one detail can swing the stock.
④ When the technology works but the business doesn’t — Even a successful technology can fail as a business if costs are too high or customers are too few. Always ask, “Who will pay for this, and how much?”
Where to Find Company Numbers
So where can you find the numbers to check these five signals yourself? Every number in this article comes from sources anyone can access for free. In this section, we cover where to find company numbers, and in the next, where to follow industry and technology news.
1Start Here — Quarterly Earnings Releases
The first thing to look at for any company is its quarterly earnings release. These are posted every quarter on a company’s investor relations (IR) website, which you can find by searching for the company name plus “investor relations.” Checking just the numbers below on the first page of the release covers most of the signals in Section 4.
| What to check | Term used in the release | Related signal |
|---|---|---|
| Quarterly revenue and growth | Revenue, YoY (year-over-year) | Revenue growth |
| Net income or loss | Net income / Net loss, Adjusted EBITDA | Cash & funding |
| Backlog | Backlog, Remaining performance obligations (RPO) | Backlog |
| Next-quarter and annual outlook | Guidance, Outlook | Revenue growth |
| Cash | Cash, cash equivalents and marketable securities | Cash & funding |
| Company-specific metrics | Key business metrics (e.g., Starlink subscribers, ARPU) | Recurring revenue |
2For More Detail — SEC Filings
U.S.-listed companies file regular reports with the Securities and Exchange Commission (SEC) through its EDGAR database. Search for “SEC EDGAR” to open the site, then search by company name or ticker (for example, RKLB).
| Filing | When it’s filed | What to look for |
|---|---|---|
| 10-Q (quarterly report) | Every quarter | Share of backlog expected to convert within a year, revenue by segment |
| 10-K (annual report) | Once a year | Business overview, Risk Factors |
| 8-K (current report) | When major events occur | Earnings, mergers and acquisitions, share offerings, and other key news |
The Risk Factors section of the 10-K lists the risks the company itself has identified, which makes it especially useful for understanding a company’s weaknesses.
3To Hear from Management — Earnings Calls
On earnings day, companies also hold an earnings call, where executives walk through the results and answer analysts’ questions. Recordings and slides are posted on the IR website, and news summaries usually follow quickly. Calls can reveal things the numbers can’t, such as the reasons behind delays and plans for the next quarter.
Where to Follow Industry and Tech News
Beyond company numbers, there are sources that track the industry as a whole and its technical milestones. You can find each one by searching for the terms below.
1Industry Numbers — Check the Big Picture Once or Twice a Year
You don’t need to look up industry-wide numbers all the time. Just check these sources when new editions come out.
| If you want to know | Source | How to find it |
|---|---|---|
| How big the space industry is | The Space Foundation’s The Space Report | Search for “The Space Report 2026” |
| Whether private investment is rising or falling | Space Capital’s quarterly investment report | Search for “Space Investment Quarterly” |
| How government budgets are trending | SpacePolicyOnline | Search for “SpacePolicyOnline” or “Space Force budget 2027” |
2Technical Milestones — Launch and Satellite News
With technical milestones, the key is to check both when something is scheduled to happen and whether it actually happened.
| If you want to know | Source | How to find it |
|---|---|---|
| When the next launch is (Starship, Neutron, etc.) | Next Spaceflight | Search for “Next Spaceflight,” then search by rocket name on the site |
| Whether a launch succeeded | Official company X (Twitter) accounts, launch livestreams | Follow SpaceX, Rocket Lab, and others; search YouTube for flight names like “Starship Flight 15” |
| How many satellites are in orbit | Company earnings releases, CelesTrak | Check “satellites in orbit” in the release, or search by constellation name on CelesTrak |
| What the company has promised | Business updates in earnings releases | Check the “Business highlights” section near the top of the release |
| Major contracts and acquisitions | SpaceNews, 8-K filings | Search for “SpaceNews,” or the company name plus “8-K” |
3Too Much to Track? — Set Up Alerts
If checking all of these feels like too much, the most reliable approach is to have the news come to you.
| Method | How to set it up |
|---|---|
| IR email alerts | Sign up under “Email Alerts” on the company’s IR website to get earnings releases and filings by email |
| Google Alerts | Search for “Google Alerts,” then add keywords like “Rocket Lab Neutron” or “Starship launch” to get related news by email |
| Official social accounts | Follow companies’ official X (Twitter) and YouTube accounts for the latest launch schedules and results |
4A Simple Quarterly Routine
It may look like a lot, but running through these steps once a quarter is enough.
Key Space Companies
Now let’s apply the five signals from Section 4 to real companies. First, we take a close look at the latest numbers and key watch points for the four largest and most closely watched publicly traded space companies, then round up other companies worth knowing by sector.
1SpaceX (SPCX) — The Industry Leader
SpaceX does it all: launch vehicles, satellite manufacturing, satellite communications, and now AI. It went public in June 2026 and posted its first quarterly profit as a public company in the third quarter.
| Item | Latest figures |
|---|---|
| Quarterly revenue | $14.6 billion in Q3 2026 (+161% YoY) |
| Quarterly earnings | Q3 net income of $4.0 billion (swung to a profit) |
| Starlink | 13.6 million subscribers, ARPU of $69 |
| Backlog & cash | $47.5 billion / about $100 billion (as of the end of Q2) |
2Rocket Lab (RKLB) — Aiming to Be ‘the Next SpaceX’
After growing with its small Electron rocket, Rocket Lab has expanded into satellites, components, and satellite communications. As covered in Part 2, it is moving quickly toward vertical integration through component acquisitions and its deal for Iridium.
| Item | Latest figures |
|---|---|
| Quarterly revenue | $234 million in Q2 2026 (+62% YoY, a record) |
| Quarterly loss | Net loss of $49 million |
| Backlog | $2.36 billion (+137% YoY) |
| Cash | About $2.3 billion |
| Next-quarter guidance | Q3 revenue of $250 million to $265 million |
3Planet Labs (PL) — Earth Observation Data
Planet Labs photographs the Earth every day with roughly 200 satellites and sells the data. It’s a leading player in the multispectral and hyperspectral imaging technologies covered in Part 2, with defense and intelligence agencies as key customers.
| Item | Latest figures |
|---|---|
| Quarterly revenue | $116.1 million in FY2027 Q2 (+58% YoY, a record) |
| Quarterly loss | Net loss of $9.4 million (down from $22.6 million a year earlier), positive adjusted EBITDA |
| Backlog | About $815 million (about 50% to be recognized within 12 months) |
| Cash | About $865 million |
| Annual guidance | FY2027 revenue of $430 million to $441 million (+40% to 43%) |
4AST SpaceMobile (ASTS) — Betting Everything on Direct-to-Device
AST SpaceMobile is building a space-based cellular network that connects ordinary smartphones directly to satellites. Its giant-antenna BlueBird satellites, covered in Part 2, are at the heart of the business.
| Item | Latest figures |
|---|---|
| Quarterly revenue | $31.5 million in Q2 2026 (more than double Q1) |
| Quarterly loss | Net loss of about $231 million |
| Backlog | About $1.3 billion (including carrier and U.S. government contracts) |
| Satellites | 13 in orbit, targeting about 45 by early 2027 |
| Annual guidance | 2026 revenue of $150 million to $200 million (concentrated in Q4) |
5The Four Companies at a Glance
| Company | Profile | Profitability | Key checkpoint |
|---|---|---|---|
| SpaceX | Industry leader, entire space value chain + AI | Turned profitable | Whether high expectations turn into results |
| Rocket Lab | Launch + satellites and components, vertical integration | Losses (narrowing) | Neutron schedule, Iridium deal |
| Planet Labs | Earth observation data | Losses (near breakeven) | Whether losses keep shrinking |
| AST SpaceMobile | Direct-to-device | Large losses | Satellite deployment pace, funding |
6More Space Companies by Sector
There are many other listed space companies beyond these four. Here they are, organized by the sectors covered in Parts 1 and 2.
| Sector | Company (ticker) | What it does | What to watch |
|---|---|---|---|
| Launch | Firefly Aerospace (FLY) | Small rocket ‘Alpha’ and lunar lander ‘Blue Ghost’ | Launch success rate, additional lunar missions |
| Space exploration | Intuitive Machines (LUNR) | Commercial lunar landers, NASA lunar cargo delivery | Size of NASA contracts, landing mission success |
| Earth observation | BlackSky (BKSY) | High-resolution imaging satellites, imagery services for defense and intelligence | Pace of next-generation satellite deployment, government contracts |
| Satellite communications | Iridium (IRDM) | Satellite phones and communications, spectrum holdings | Progress of the Rocket Lab acquisition (expected to close mid-2027) |
| Satellite communications | Viasat (VSAT) | Geostationary satellite internet, in-flight Wi-Fi | Competition from LEO satellite internet |
| Satellite communications | Globalstar (GSAT) | LEO satellite communications, emergency messaging for Apple iPhones | Progress of the Amazon acquisition (agreed in April 2026 for about $11.6 billion, expected to close in 2027) |
| Space infrastructure & components | Redwire (RDW) | Space solar arrays, space structures, defense drones | Rising component demand, improving profitability |
| Space infrastructure & components | Voyager Technologies (VOYG) | Part of the team developing the commercial space station ‘Starlab,’ defense and space components | Commercial space station development schedule |
| Space infrastructure & components | Karman Space & Defense (KRMN) | Components for missiles, rockets, and satellites | Defense budgets and component orders |
| Traditional defense & aerospace | Lockheed Martin (LMT), Northrop Grumman (NOC), L3Harris (LHX) | Military satellites, crewed spacecraft, in-orbit servicing, and more | Government contracts, share of revenue from space |
Trends to Watch — Acquisitions and Private Companies
In satellite communications, Iridium (Rocket Lab) and Globalstar (Amazon) have both become acquisition targets. As discussed in Part 2, companies that own spectrum and satellite networks are becoming more valuable.
There are also many private companies, such as Blue Origin, radar satellite operators ICEYE and Umbra, and commercial space station developers Vast and Axiom Space. None of them are publicly traded yet, so it’s worth keeping an eye out for IPO news.
If Picking Stocks Is Hard, Consider Space ETFs
As Section 7 showed, every space company has clear strengths and risks, which makes it hard to pick the winners one by one. In that case, investing across the whole industry through a space ETF that holds many space companies at once can be a good option. You’ll be less exposed to the success or failure of any single company while still capturing the growth of the industry as a whole. That said, space ETFs vary widely in what they hold and how they’re managed, so it pays to check a few things before choosing one.
1Major Space ETFs at a Glance
| ETF | Management style | Highlights |
|---|---|---|
| Procure Space ETF (UFO) | Index-based | The original space ETF, launched in 2019, focused on ‘pure-play’ companies with a large share of space revenue |
| ARK Space & Defense Innovation ETF (ARKX) | Active | Holds defense and aerospace technology companies alongside space, with a 0.75% expense ratio |
| SPDR S&P Kensho Final Frontiers ETF (ROKT) | Index-based | A distinctive mix that includes deep-sea exploration companies alongside space |
| Tema Space Innovators ETF (NASA) | Active | Launched in March 2026; drew attention for holding SpaceX before its IPO |
A wave of new space ETFs launched in 2026 ahead of the SpaceX IPO, and three funds, including UFO and ARKX, have surpassed $1 billion in assets.
2Four Things to Check Before Choosing
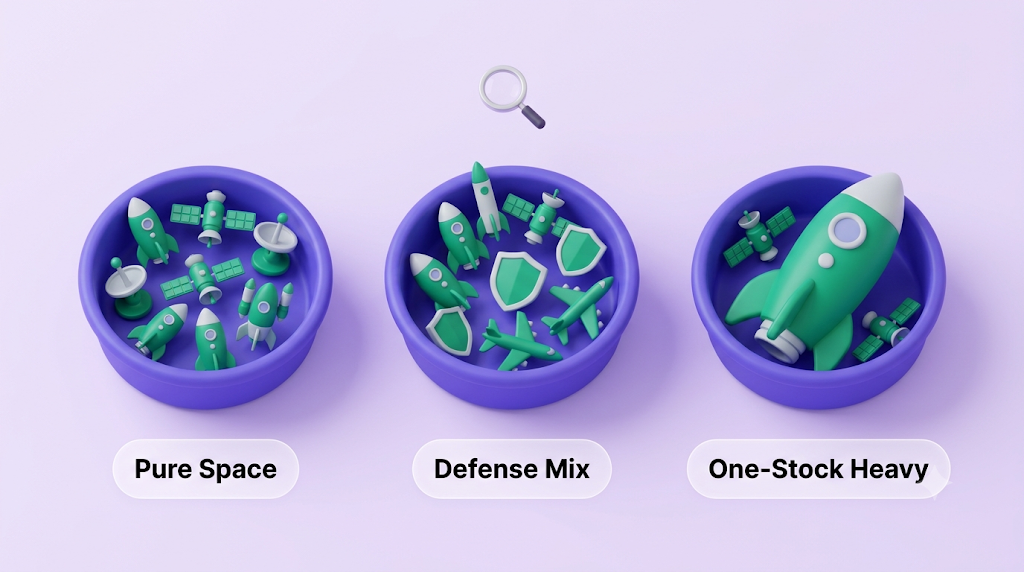
How Much SpaceX Does It Hold?
Since the SpaceX IPO, space ETF returns have diverged sharply depending on their SpaceX weighting. Some newer ETFs hold more than 25% in SpaceX alone. Those funds effectively move with SpaceX’s share price, which weakens the main benefit of an ETF: spreading your investment across many companies.
Pure Space, or Mixed with Defense?
Some ETFs, like UFO, focus on companies with a large share of space revenue, while others, like ARKX, also hold defense and aerospace companies. Adding defense names can reduce volatility, but the fund may not fully capture the growth of pure-play space companies.
Index-Based or Actively Managed?
Index-based (passive) ETFs follow set rules for selecting holdings and tend to have lower fees. Active ETFs rely on a portfolio manager to pick stocks in hopes of beating the market, usually at a higher cost. Even within the same space theme, an active ETF’s performance can vary widely depending on the manager’s decisions.
Concentration and Fees
Also check what share of the fund the top five to ten holdings make up, and what the annual expense ratio is. The more concentrated the top holdings, the more the whole ETF will swing with a handful of stocks.
| What to check | What to look for |
|---|---|
| SpaceX weighting | Whether the fund is overly concentrated in one stock |
| Fund makeup | Whether it focuses on pure-play space companies or also includes defense and aerospace |
| Management style | Whether it is index-based (passive) or actively managed |
| Concentration & fees | Weight of the top holdings and the annual expense ratio |
Key Takeaways
| Indicator | Key figure |
|---|---|
| Global space economy | $686 billion in 2025 (+12% YoY) |
| Share from commercial activity | About 79% |
| Long-term outlook | Over $1 trillion in the 2030s (varies by source) |
| Private investment | Peaked in 2021 → corrected → recovered to more than $12 billion in 2025 |
| Global orbital launches | About 114 in 2020 → about 320 in 2025 |
| Satellites launched in 2025 | 4,517 (87% commercial) |
| U.S. Space Force budget | About $15 billion in FY2021 → about $40 billion in FY2026 |
Final Thoughts
In this final part of the Space Industry Structure series, we looked at the space industry through numbers. The global space economy has already grown to $686 billion, and launches, satellites, defense budgets, and company revenue are all rising fast. The growth of the space industry is no longer a story about the distant future; it’s a reality you can confirm with numbers today.
That doesn’t mean every space company will succeed. As the 2021 boom and correction showed, value built on hype alone can vanish quickly. That’s why it matters to keep checking whether backlog is growing, whether companies keep their schedules, and whether they have the cash to hold out until they succeed. And because space companies range from profitable leaders to companies still investing heavily, the numbers to check differ from company to company.
Part 1 covered the structure of the space industry, Part 2 the technology inside it, and Part 3 the numbers. With all three perspectives, you’ll be able to read the flood of space industry news ahead with a sharper eye, asking: “How will this show up in the numbers?” If you haven’t read Parts 1 and 2 yet, we recommend starting from the beginning.
Learn how space went from an industry that only spent money to one that makes money, starting with upstream and downstream and how SpaceX earns its revenue.