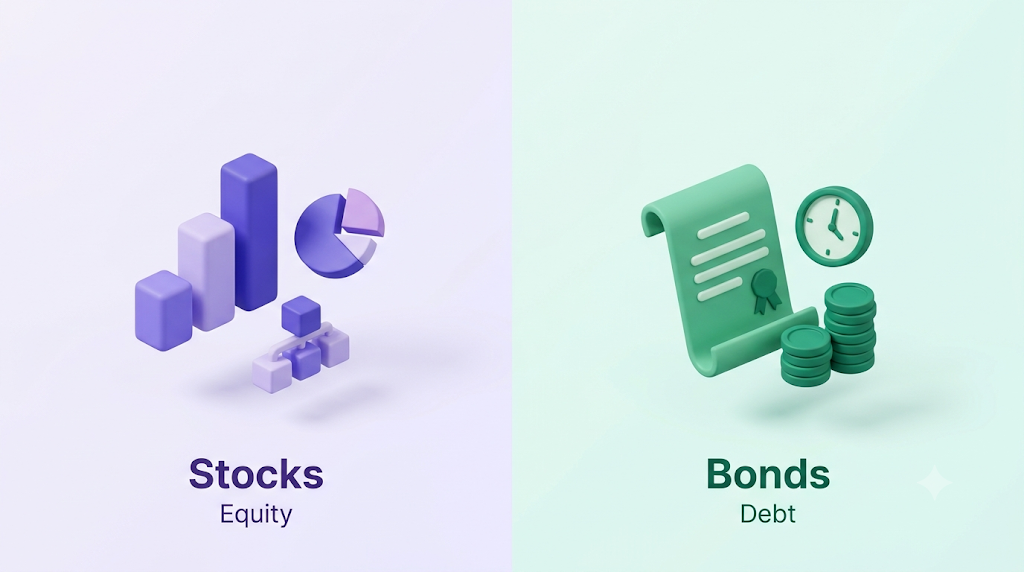
Understanding Interest Rates and Bonds

“Treasury yields spike,” “the yield curve inverts”… These headlines appear daily, yet interest rates and bonds are what beginners find hardest to grasp. In truth, the two are two sides of the same coin. When rates move, bonds move with them — and once you understand that relationship, news that once felt impenetrable becomes far easier to read. Today we’ll start with what an interest rate actually is, then work through bonds, Treasuries, and the yield curve in order.
What is an interest rate?
1An interest rate is the ‘price of borrowing money’
In a word, an interest rate is the price charged for borrowing and lending money. Just as goods have prices, so does money. When you deposit money at a bank you receive interest (you’ve lent money to the bank); when you take out a loan you pay interest (you’ve borrowed from the bank). That rate is the interest rate.
2Who sets it, and where — the policy rate
When the news says rates were “raised” or “lowered,” it usually means the policy rate. Set by a country’s central bank, the policy rate is the benchmark that serves as the starting point for every other rate in the market — deposits, loans, and bond yields alike. When it moves, banks’ funding costs move with it, and that ripples through to deposit, loan, and bond rates.
| Country | Decision-making body |
|---|---|
| 🇺🇸 United States | The Federal Reserve decides at FOMC meetings (8 times a year) |
| 🇪🇺 Eurozone | The European Central Bank’s Governing Council decides (8 times a year) |
3Why the policy rate is the ‘benchmark’
Why does a single rate become the benchmark for everything? Because banks themselves borrow and lend to each other on a short-term basis, and the policy rate is what they reference when they do. When it rises, banks’ funding costs rise, and that burden passes straight through to deposit and loan rates. So the policy rate alone tells you whether borrowing money is broadly expensive or cheap right now.
Why are rates raised and lowered?
Interest rates are the steering wheel a central bank uses to guide the economy. When prices climb too fast, it raises rates to cool an overheating economy; when the economy weakens, it lowers rates to loosen money and revive activity. That’s why you hear phrases like “a hike to tame inflation” or “a cut to stimulate growth.” Let’s unpack why that cause and effect works.
| Low rates | High rates | |
|---|---|---|
| Cost of borrowing | Cheap → easier to invest and borrow | Expensive → investing and borrowing weigh on you |
| Market liquidity | Money flows out (supply expands) | Money is absorbed (pulled into deposits) |
| Investment & spending | Increase | Decrease |
| Economy & prices | Pick up (risk of overheating) | Cool down (risk of recession) |
Looking at it this way, you might think, “If inflation is the problem, just raise rates.” In practice it isn’t that simple — and the next section explains why.
Why must rate hikes be handled carefully?
1Why can’t they just raise rates?
“If inflation is the problem, why not just hike?” The catch is that a rate hike has such far-reaching effects that it can’t be done casually. As we saw, even a small move shakes investment, spending, and liquidity all at once. Think of it as medicine that works powerfully — but comes with strong side effects.
2The pros and cons of raising rates
When interest rises, people choose saving over spending, market liquidity shrinks, and prices come under control as a result. Higher yields also make the currency more attractive to foreign investors, supporting its value. On the other hand, governments, companies, and households all face heavier debt payments, so spending and investment contract. When corporate investment falls, jobs and share prices follow, leading to recession. And where debt is heavy, governments and politicians are hardly enthusiastic about hikes either.
| Benefits of raising rates | Drawbacks of raising rates |
|---|---|
| Absorbs liquidity → stabilizes prices | Heavier interest burden → spending and investment contract |
| Supports the currency’s value | Investment, jobs, and shares fall → recession |
| — | Debt burden and political resistance |
Why does the US government want rate cuts?
One of the parties most eager for rate cuts is the government — especially one carrying heavy debt. The United States in 2026 is a textbook example.
1America’s interest burden
With so much national debt, the US spends an enormous sum simply servicing the interest. In fiscal 2026 it has paid roughly $827 billion in interest on Treasury debt alone — more than its defense budget. If rates stay where they are, forecasts suggest annual interest could sail past $1 trillion and reach as high as $1.4 trillion.
2President Trump’s push for cuts rests on two arguments
That’s why President Trump has pressed the Fed hard to cut rates, going so far as to call it “rocket fuel.” His reasoning runs along two lines.
3How rates, prices, and the economy interlock
Interest rates are thus tightly bound up with prices, debt, and growth. The US had in fact kept rates high for quite some time even before the recent conflict sent oil prices — and inflation — climbing again. As we saw, high rates tame inflation by weighing on the economy. But that came at the cost of weaker investment and recession risk, and it’s that burden the government now wants to ease.
Why do rates and bonds move in opposite directions?
Now it’s time to look at how bonds and interest rates connect. Why do bond prices fall when rates rise?
1Why do new bonds pay more when rates rise?
A bond is ultimately just a way of borrowing money: a government or company that needs funds issues one and borrows from investors. But when market rates rise, simply parking money in a bank deposit earns more interest. Investors then think, “Why buy a bond when the bank pays more?” So anyone issuing a new bond has to offer interest more attractive than a bank deposit to draw investors in. That’s precisely why yields on newly issued bonds rise alongside market rates.
2So what about the bond I already hold?
This is where the problem arises. You bought a bond earlier at a low rate — say 5% — and now the market offers new bonds paying far more, say 10%. Who would buy your lower-paying bond at its original price? No one. So to sell it, you have to discount the price enough that the buyer still comes out ahead. That’s exactly why existing bond prices fall when rates rise. Conversely, when rates fall, your comparatively high-paying bond becomes more desirable and its price goes up.
3Seen through a simple bond example
Imagine a bond that repays $1,000 in a year, which you buy for $950 to earn $50 — a yield of about 5%. You hold that bond. What happens when market rates change?
| Scenario | Yield on new bonds | Fate of your 5% bond | Selling price |
|---|---|---|---|
| Baseline | 5% | Still in demand | $950 |
| Rates rise | 10% | Out of favor → must be discounted to sell | $900 ($100 gain ≈ 10%) |
| Rates fall | 3% | More desirable → sells at a premium | More than $950 |
If market rates climb to 10%, newly issued bonds pay far more, so no one will buy your 5% bond at $950. To sell it, you’d have to discount it to $900 so the buyer can earn that same 10%. Conversely, if rates drop to 3%, your 5% bond looks attractive and you can sell it for more.
The longer the maturity, the bigger the swing.
What is a government bond?
1What a government bond is
It’s a bond issued by a national government — in the US, these are Treasury securities. When a country needs money for spending or to repay debt, it borrows from investors and issues a certificate promising to repay principal plus interest after a set period. Because the issuer is a sovereign state, these are treated as far safer than corporate bonds.
2Treasuries come in many maturities
Treasuries vary by how long until repayment. Here are the main types.
Even for the same issuer, different maturities carry different yields.
3Bond yields: the ‘real’ rate the market sets
Here’s where confusion often creeps in: the policy rate (set by the Federal Reserve) and Treasury yields are not the same thing.
| Policy rate | Bond yield | |
|---|---|---|
| Who sets it | Set directly by the central bank | Formed through market trading |
| Scope | Very short term | Varies by maturity (short term to 30 years) |
In short, the policy rate is a figure the central bank pins down, while bond yields are what the market prices moment to moment. The two do influence each other — when the policy rate rises, markets tend to push bond yields up in response. But bond yields also reflect inflation expectations, growth outlooks, and sovereign creditworthiness, so they move on their own terms.
What happens when Treasury yields rise?
1What a ‘yield spike’ means
Once you know that yields and prices move inversely, the news reads clearly. “Bond yields spiked” means “bond prices fell” — a signal that investors are selling that government’s debt.
2The real reasons yields rise are varied
Beginners often misread this. It’s a mistake to assume rising yields always mean a sovereign credit crisis. There are four main reasons yields climb.
Credit concerns are just one of the four. When the US 10-year yield jumped to 4.7% in 2026, it wasn’t a credit crisis — it was driven mainly by tariff and inflation worries alongside a tightening mood.
3The effects of a yield spike
Because Treasury yields anchor market rates across the economy, a rise ripples widely.
What is the yield curve?
1Connect the yields by maturity and you get a curve
As we’ve seen, Treasuries carry different yields at different maturities — 1-year, 2-year, 10-year, 30-year. Plot those yields by maturity and connect them, and you get a single line: the yield curve. Think of it as a map of interest rates.
2What a normal curve looks like
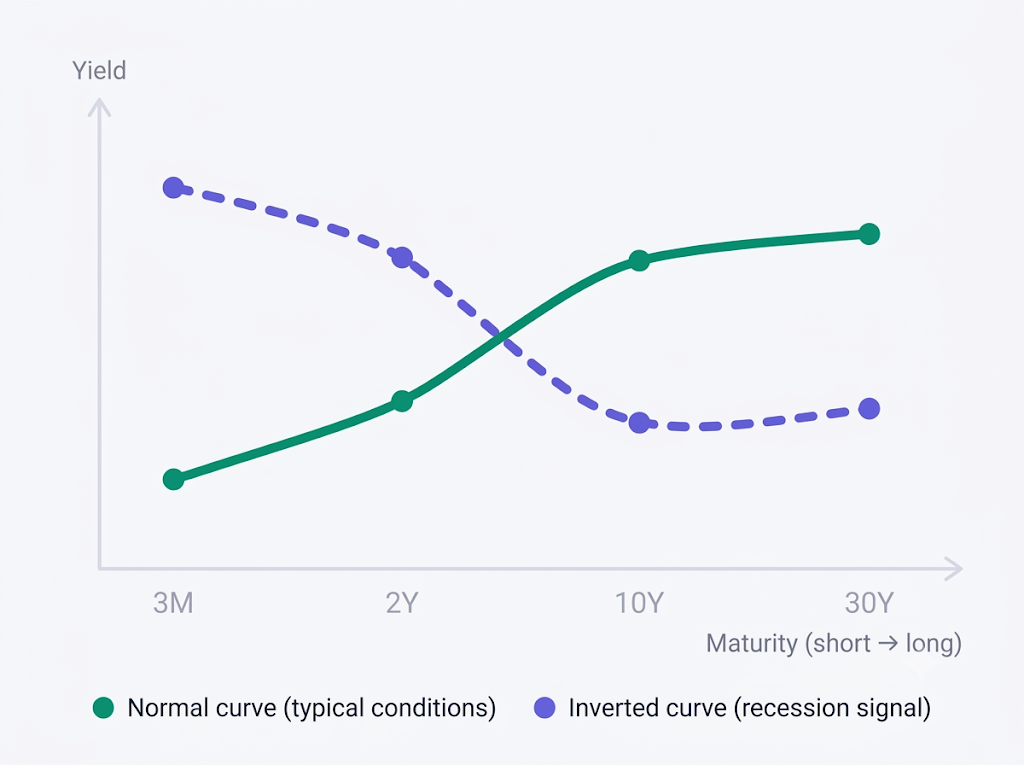
Normally, the longer the maturity, the higher the yield — an upward slope. The further out you go, the more uncertain things are, so you’re compensated more for locking money away. Note that short-term yields are sensitive to central bank policy, while long-term yields reflect inflation, growth, and sovereign credibility.
3Two directions the curve moves — steepening and flattening
The curve moves in two broad directions: steepening (getting steeper) and flattening (leveling out). Steepening carries opposite meanings depending on its cause, so it’s split into bear steepening and bull steepening.
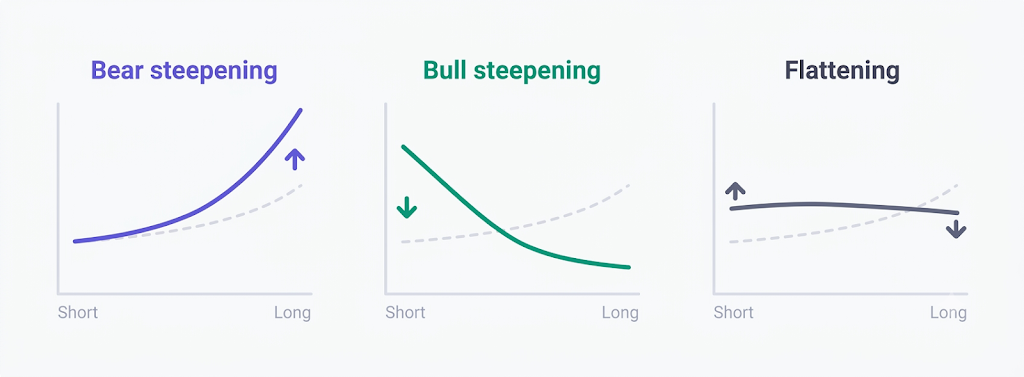
So “the curve moved” tells you nothing about whether that’s good or bad. You have to ask which end moved, and why.
4Yield curve inversion
This is the reverse of normal: short-term yields rise above long-term ones. It happens when the central bank hikes short-term rates hard to fight inflation, while the market — anticipating a recession — pushes long-term yields down in advance. The news usually tracks this as the 10-year minus 2-year spread; when that figure turns negative, the curve is inverted.
Why is this seen as a warning sign? Three reasons.
Key summary
1Policy rate vs. bond yield
| Policy rate | Bond yield | |
|---|---|---|
| Who sets it | Central bank (the Federal Reserve) | The market (investor trading) |
| Scope | Very short term | Varies by maturity (short term to 30 years) |
| How it’s decided | Decided directly at meetings | Formed daily in the market |
2What each curve shape means
| Curve shape | Appearance | General meaning |
|---|---|---|
| Normal | Upward slope (long > short) | Business as usual |
| Bear steepening | Long-term yields spike | Inflation or fiscal concerns |
| Bull steepening | Short-term yields fall | Expectations of easing |
| Flattening | Short-long spread narrows | Tightening underway, a precursor to inversion |
| Inversion | Short > long | A leading recession signal |
3Beginner’s checklist
Wrapping up
The vocabulary around rates and bonds feels foreign at first, but nearly all of it comes down to the story of the price of money rising and falling. The central bank sets that price (interest rates) and the market trades on it (bonds and government debt) — that’s what we covered today.
Now, when you come across “yields spike” or “the curve inverts” in the news, you’ll be able to read a layer deeper.
Rather than reacting to a single number, get in the habit of asking which way this means the price of money is moving. That’s the first step to making rate and bond news work for you.